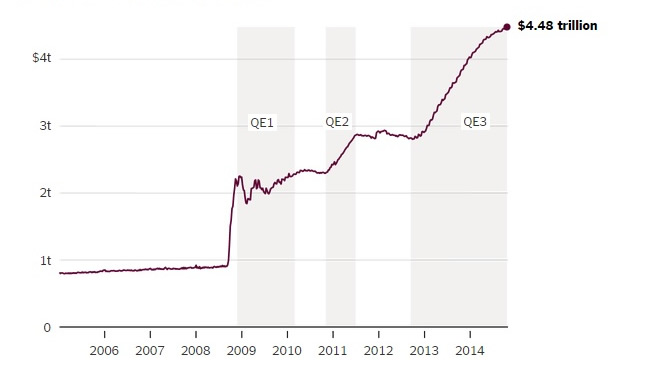
TOTAL ASSETS HELD BY THE FEDERAL RESERVE
SOURCE: NEW YORK TIMES
In three phases since 2008, the Federal Reserve has bought trillions of dollars in bonds, using newly created money to stimulate the economy.
The third phase of Quantitative Easing is likely to end this month (October 2014)
PERCENTAGE OF TOTAL FEDERAL RESERVE ASSETS
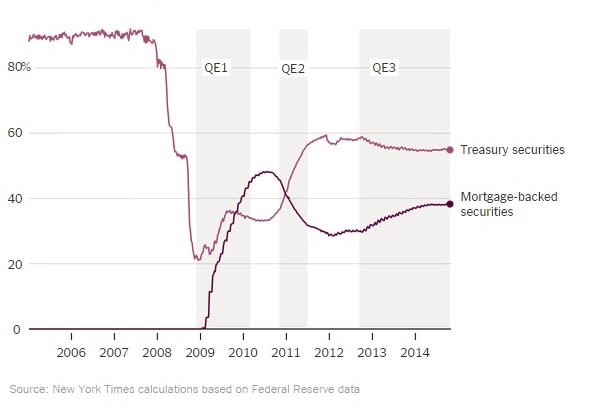
SOURCE: NEW YORK TIMES
In its first and third rounds of quantitative easing, the Fed bought not just the U.S. government debt it has traditionally owned,
but securities backed by Americans’ home mortgages.
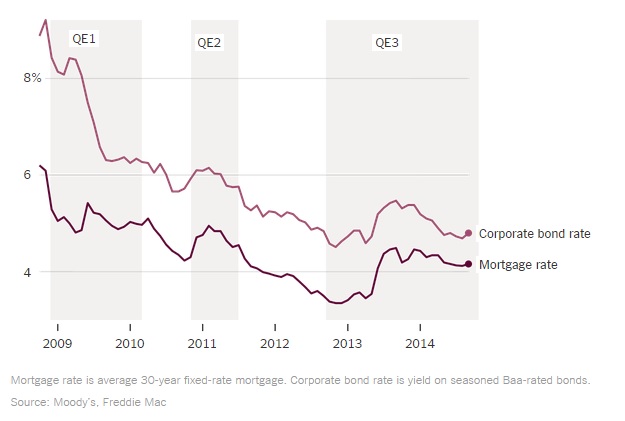
SOURCE: NEW YORK TIMES
Amid the Fed’s quantitative easing programs, interest rates for both American home buyers and large businesses have fallen.
S&P 500-STOCK INDEX, DIVIDED BY AVERAGE EARNINGS OVER PREVIOUS 10 YEARS, INFLATION ADJUSTED
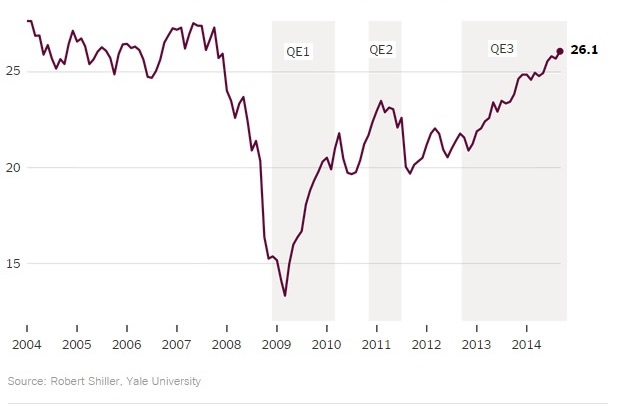
SOURCE: NEW YORK TIMES
Stocks are trading at a level they previously only reached during the late 1990's stock market bubble and just before the financial crisis.